DC Rainmaker Review Updates:
Got two items of note today for you. First, the most important one (ok, that’s probably debatable). Over the past week I’ve been slowly chipping away at adding in a bunch of updates to the FR910XT review that I posted back in October. A bunch of sections were updated/added/clarified/photofied. They are as follows:
– Openwater swimming comparison/details (lots of pretty Bora Bora pics too!)
– Indoor pool swimming troubleshooting section
– Paddleboarding section added
– Skiing section added (snow sports)
– How to edit our swims (fix errors) section added
– Ultra-long battery methods (55hr+)
– Random other updates sprinkled about…
This is in addition to the sections I added a few weeks ago with all the details on the new quick release strap, extender strap, and fabric strip.
The biggest item of note is really the pool swim troubleshooting section. I’ve been getting lots of questions on how to get accurate swim data. Given I’ve managed to actually only have a single miscounted lap in 5 months of using the FR910XT, I figured I may be a good one to offer some tips on it. So, I go into a Top-10 style list of ways to get accurate data. If nothing else, you might find it funny.
As usual, I continue to answer questions on the FR910XT posted to that thread…up to nearly 400 questions in total. Crazy!
And finally, last night (Wednesday) I got my pile of FR910XT’s that I ordered from Amazon (both January and February orders). People in the know have stated that Amazon’s backlog should be basically cleared now (and that’s reflected in that you can buy a FR910XT and have it arrive next day). Good stuff…now, what to do with those FR910XT’s?
Garmin Connect Updates
Yesterday Garmin Connect added a bunch of updates to their online training log platform. Many of these updates have to do with power and analysis of it. Without too much more preface, let’s dig into it.
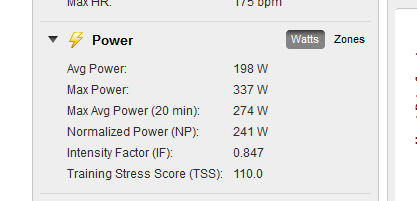
First up is the addition of TSS/NP/IF into the sidebar. Note that these metrics are ONLY calculated at this time for rides done with a device capable of displaying TSS/NP/IF.
This is inline with the support of these TrainingPeaks metrics in their other device products (currently only Edge 800, but soon coming to the Edge 500 and FR910XT). Unfortunately, there doesn’t appear to be a way to calculate it for other rides not done on these devices – which is too bad, as it would have been a nice benefit.
As always, remember that if you’re using TrainingPeaks online, you’ll want to ensure that your FTP value is set identically between TP and GC and the device itself. Otherwise, things will get all dorked up (they won’t match).
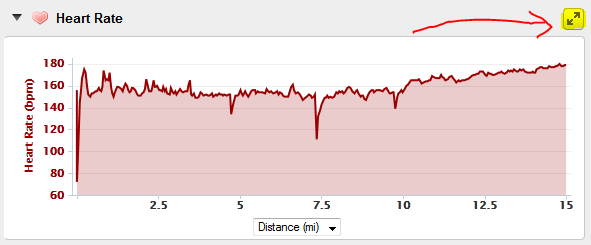
The next item of note is that all of the graph windows are expandable. This is much better, as the previous graphs were the size of Ritz crackers, and basically not terribly useful for analytics. At the corner of every graph is a little expandomatic button:
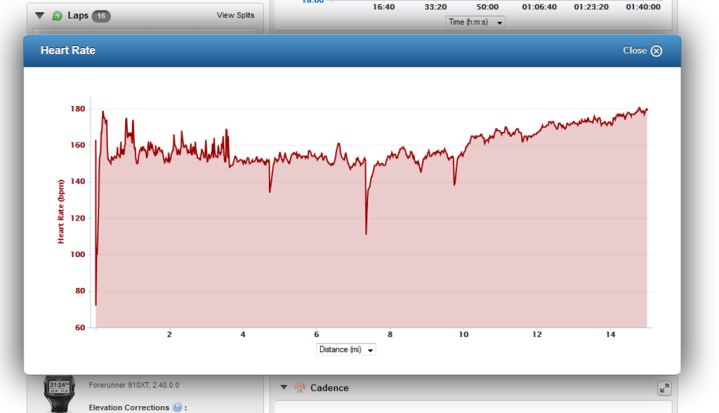
Which in turn, expands it to a much larger window. I do wish though that they would put some simple mile/time marker vertical lines up though. Note that the new expandomatic feature is applicable for ALL graphs within Garmin Connect (HR/Pace/Speed/Cadence/Power/etc…).
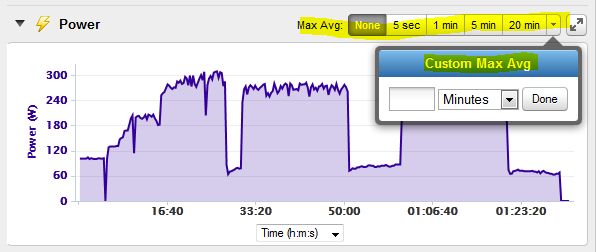
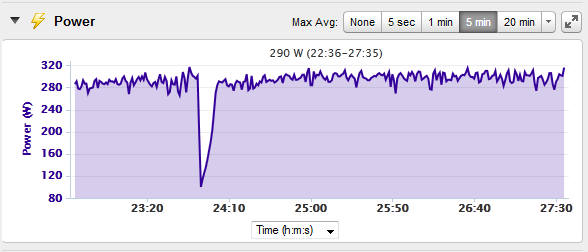
Moving back into the power side of things, you’ll now be able to show Max averages for 5-second, 1-min, 5-min, and 20-min. Or, just simply select your own timeframe (in either minutes or seconds). This basically gives you the average maximum for that time period. Meaning, if you selected 5 minutes, it’ll find ‘highest’ 5 minute period.
You can see here if I change the setting to 5 minutes, how it looks. You can see that the highest 5-minute average for this ride was 290w, and it occurred between minutes 22:35 and 27:35.
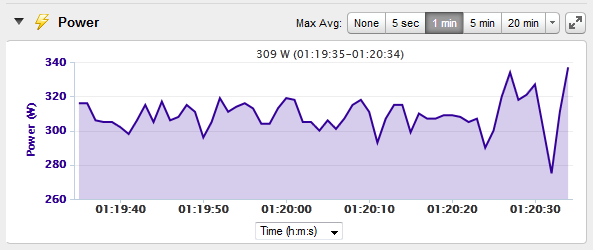
Meanwhile, if I change it to 1-minute, you’ll see the highest was between 1hr 19m and 35s, and 1:20:34, where I maintained 309w.
Make sense? Good. If you want to play around with how the data looks, feel free to use this activity of mine since it’s a bit longer and easier to see.
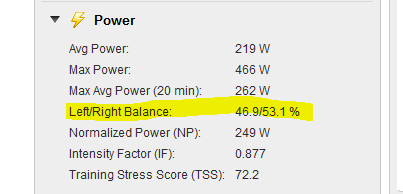
Finally, they now support left/right power and/or power balance, for ANT+ enabled power meters that support it. Today, that’s basically the SRAM RED Quarq 2012, but obviously this feature is for Garmin Vector, when it comes out this summer. Additionally, it’ll benefit Brim Brothers, O-Synce and Pioneer, with their ANT+ enabled left/right power meters when they come out.
The first thing you’ll notice is that the sidebar now includes a quick left/right summary for activities that have the data:
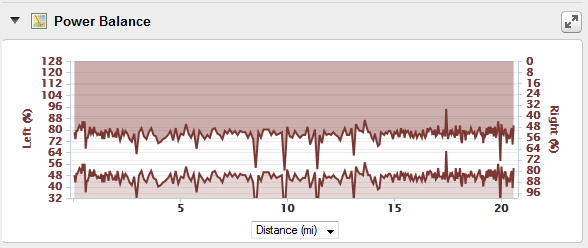
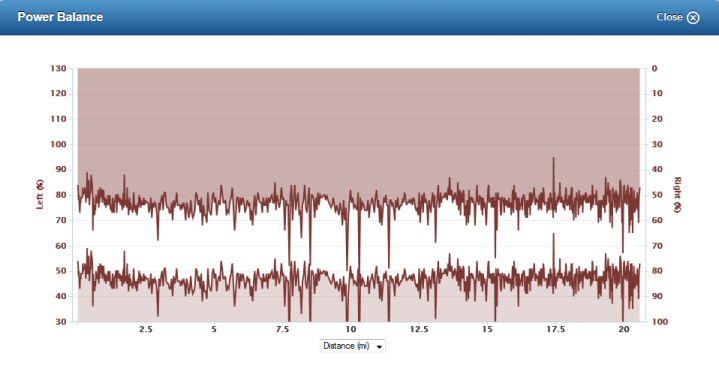
But the main deal is that there’s a new chart in town, which is like the rest of the charts, except dedicated to left/right power.
If you expand it (click the image below), what you’re essentially looking at is two graphs, on two different levels, combined into one graph. The upper portion is the right leg aligned to the right axis numbers, while the lower portion is the left leg with the left axis numbers. They could have made this slightly less confusing if they had simply aligned the ‘Left %’/’Right %’ descriptors either up or down on that graph. But, if you stare at it long enough it’ll make sense.
(Note that Garmin says they are still refining the left/right graphs a bit. Given that literally only a handful of folks have devices capable of capturing this data, it’s a reasonable thing to still do some feedback/refining development cycles)
Garmin Connect is bit different than TrainingPeaks implementation in that TP doesn’t actually have a graph function for left/right power today. But, they do allow better analysis of the data within TP since you can slice/dice the data more easily. But Garmin themselves has made public statements that for the advanced cyclist, TrainingPeaks is really the better option.
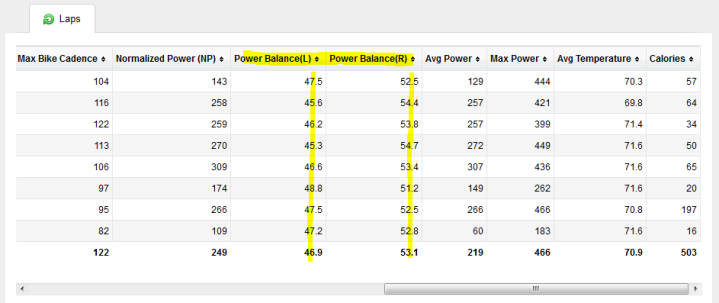
Now, Garmin Connect does have lap left/right power, but it’s a bit more difficult to analyze that way because you can’t re-arrange the columns like you can in Training Peaks. So you’re constantly scrolling left/right.
Got all the changes? Make sense? Good. If not, feel free to poke around at the above file with the Quarq I did last night (which has power balance). Note that one of the intervals may look like I was having trouble…and I was, my tire was slipping a bunch – so I had to get off and fix it. No worries, but just for the Wattage heads amongst you, why it looks the way it looks.
Now go forth and analyze! And as always, feel free to drop questions below. Thanks for reading!
FOUND THIS POST USEFUL? SUPPORT THE SITE!
Hopefully, you found this post useful. The website is really a labor of love, so please consider becoming a DC RAINMAKER Supporter. This gets you an ad-free experience, and access to our (mostly) bi-monthly behind-the-scenes video series of “Shed Talkin’”.
Support DCRainMaker - Shop on Amazon
Otherwise, perhaps consider using the below link if shopping on Amazon. As an Amazon Associate, I earn from qualifying purchases. It doesn’t cost you anything extra, but your purchases help support this website a lot. It could simply be buying toilet paper, or this pizza oven we use and love.









But has Garmin fixed ‘search within view’ when exploring on garminconnect? It hasn’t worked for months, numerous threads in garmin forums, and they’ll acknowledge it doesn’t work if you start a ticket. Yet they don’t fix it…
Good catch! But zooming in is already possible with the charts, select an area you want to zoom into, while holding down the left button of the mouse! Although the resolution is not going to get better (so there is still no way of plotting all data you have recorded with, e.g., 1 sec resolution…).
“I do wish though that they would put some simple mile/time marker vertical lines up though, as well as allow zooming in.”
you don’t have a vertical line but you can see graph values if you pass over it.
And you can zoom dragging a rectangle over the graph, it zooms in.
Both in “Ritz size” and expanded views
Ops, I didn’t see Peters comment…
This is an improvement, but it’s a crying shame Garmin Connect doesn’t offer basic histograms or simple bar charts.
Given you can define zones (HR, Power, Speed) on devices it seems a no-brainer to be able to see a simple report of time within zones and then a bar chart for each activity.
Then the other thing which is weak on GC is time-based charts. Rather than crude data tables, I’d love to see some bar or line charts with Excel pivot table-like functionality, so that you can select a range of rides, choose a variable and then how it will be aggregated (weekly, monthly, annually). Then GC would be truly useful!
Strava for example does bar charts quite nicely and Polar even has this integrated with their calendar function, so that you can see the distribution of ride intensity for each ride and overall for each week.
Dude, you’ve ALWAYS been able to zoom GC charts. Just click and drag. They use Highcharts, which support it natively.
I ordered a 910xt (with Heart Rate Monitor) from Amazon on January 20 and is still showing a March 21 estimated delivery date, despite showing up for immediate shipping on the product page. This doesn’t make sense. Maybe I’ll try reordering.
It looks like the immediate-ship orders are through 3rd party vendors, even if being fulfilled by Amazon. I tried to cancel my backorder that is directly from Amazon without success, so hopefully that means it is shipping today and not 2 weeks from now.
BTW, I purchased through the referral link – thanks for the great reviews and contant updates!
Thanks all on the zooming in, fixed!
On the Amazon orders, it does depend a bit on which vendor. As noted, if you’ve got a sub-vendor, then it could be different timelines. Cancelling and just re-ordering is easiest (I’d actually re-order, then cancel – since that preserves things until the first one ships).
Garmin seems to have taken off the column in the running stats that calculates your time when moving (so you didn’t have to hit the watch every time you were felled by a stoplight). Any idea how I can get that back?
My biggest annoyance with connect is not having a cumulative split time. If I do a 10 mile run, it tells me how fast I ran mile 5, but doesn’t tell me what time I went through 5 miles in. All the info is there, why not do the maths for me?
Thank you very much for updating all your articles. I have been meaning to say it to you and this seemed like a great opportunity. I am a huge fan of your reviews and will be a loyal reader for as long as you write.
Now what to do with all those FR910’s….:-)
Hi,
Always cool reviews – thanks.
Garmin Connect can now graph data in 6 dimensions from devices that hardly anyone has, but it can’t keep track of how many miles are on my shoes?
Studies have shown that a high percentage of runners wear shoes. How about some equipment tracking?
The new updates also removed the “Moving Time” and “Moving Pace” fields from Garmin Connect. I am really annoyed that those fields have been removed!!
Do you have any influence with Garmin that could pursuade them to reinstate Moving Time?
Does SportsTracks have a facility to calculate this (I couldn’t spot one).
Thank you for a brilliant site.
Hey Ray,
If you are looking for something to do with your extra 910xt(s), I have a proposition for you. If by the luck of the draw I am not the winner of your 910XT giveaway (crossing fingers but not holding my breath, can I interest you in a “work for watch program”. I do have a pretty substantial technical background, which may be beneficial to your site. If this is something you would like to explore or entertain, shoot me an email :)
Claude
Does anyone have an example TCX file (from an Edge 800) with these new fields in it?
We can then add it to our wattbike2garmin.com software.
I have been running with a 310XT & footpod for nearly a year. Typical cadence is 90+ running and 60+ walking. Suddenly those figures have shot up to about double and the visual presentation graph has changed too. These changes have been made retrospectively throughout my Connect records. Yet there is no mention of these changes in Garmin’s list of updates. Does anyone know what is going on, and how to complain? I have tried telephoning but they say they have no idea and can’t help.
I suspect they’ve just changed it to match the FR620 Running Dynamics records that basically shows both feet in the metric. Simply put – doubling it.
Hi Ray,
My wife and I each have a 910XT. When I try to use “Send to Device” in Garmin Connect for courses, it only shows them by Unit ID, which is annoying enough to look up to make sure I’m sending it to the right device each time. But even worse than that, in some screens, the Unit ID is not even visible and I just have to guess which device I’m sending data to.
Do you know of any way to either block her device from showing up in my account, or give the devices nicknames?
Thanks!
Do activities in the garmin connect app on the iPhone sync to the garmin connect website? If so how do you set that up?