(Note from Ray: Two weeks ago when I published the results of the Bod Pod and body fat scale testing, a reader who happens to be a PhD Candidate in Pharmaceutical Sciences – Nathaniel Page – made an offer to do a guest post with a bit of analysis on the results from a statistics standpoint. In particular, to explain why it is that from a pure numbers standpoint these companys can often claim such high levels of accuracy, when the real person to person results we saw were much different. Some of the below may be hardcore geek, but if you read through the text – it really explains why we see such differences. Thanks Nathaniel – awesome stuff!)
Being a science nerd and avid runner, I looked at the pile of data Ray collected using the BF% scales and Bod Pod and felt an unhealthy overwhelming urge to analyze it. I volunteered my interpretation, Ray accepted and here is my guest post.
How Bioelectrical Impedance Analysis (BIA) Scales Work
Ray covered how the Bod Pod worked so I’ll cover some background about how bioelectrical impedance analysis (BIA) scales determine BF%. At the heart of the matter is that fat conducts electricity more poorly than lean body mass (muscle, bone, blood, etc) and the scales exploit this. When you stand on the metal pads, the scale shoots a small electrical current up one leg and down the other and measures the resistance (impedance) using Ohm’s Law. A person with more body fat will have a higher resistance than a lean person. Of course, the scale also measures your weight.
The scales then use a multiple regression equation to determine BF %. To develop the regression equation, the engineers that made the scale collect a whole bunch of descriptors of a population of people they want the scale to work for. These may include impedance, weight, height, sex, age, athletic status (or anything else). They also get a gold standard measure of BF%. They then use the descriptors to create an equation that will predict BF%. It is a balance between a using too few descriptors and having a poor equation and using too many and making a convoluted equation.
An example of one of these equations a scale may use is:
(Z is impedance (electrical resistance) in ohms, height is in meters, weight is in kilograms and age is in years (from reference Jebb et. al. Br J Nutr. 2000 Feb;83(2):115-22))
So to use this equation, the person will input their height, sex, age, and weight. The scale will determine impedance and weight, do the required math and spit out your BF%. Every scale/manufacturer will have their own special equations.
The problems with BIA scales is that the equation is the best fit for a given population of people. But you may not fit in that defined population and thus the equation may not accurately define you. That’s why some scales have a “normal” and “athlete” setting. The manufacturers have recognized that these two populations of people need different equations to describe them and the scales can switch between them. The other issue is that impedance can be altered by hydration status, calluses on their feet or a slew of other trivial factors.
A Brief Overview of Statistics
This section is for some of the readers who may not have a statistics background. For all the people well versed in the subject, I apologize in advance for the butchering of definitions and any other transgressions. When someone says that the two averages are statistically significantly different it means that the difference that is seen is not likely due to random chance alone. We usually use a cut off of less than 5% probability the difference is due to random chance and it is usually written as “p”.
A theoretical example; if I took 20 people and measured their heart rates before and after doing jumping jacks for 1 minute. The average HR before is 50 and after is 150 and I get p
Analysis of Scales
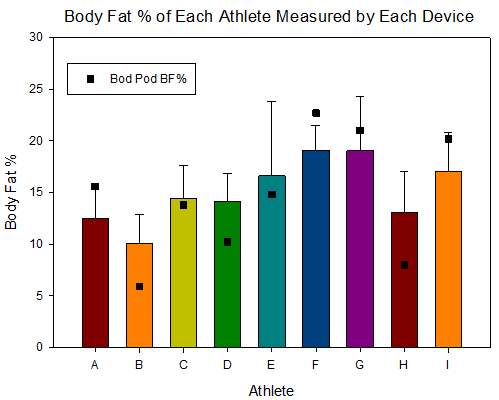
I had a nice pile of data to look at using the raw Excel files Ray posted. Using nine athletes (ATH) with measurements from 8 devices (the Bod Pod and 8 different scales/settings) I plotted the data two ways. The first graph is the mean ± standard deviation of athlete using the different devices. The Bod Pod BF% reading is the square for your reference. We see that some athletes have little variability in the BF% reading when using the different devices (ATH A, B and F) while others have a big spread (mainly ATH E). This goes back to the equations used by the scales and ATH E may not be as accurately described by them as the other subjects. The Bod Pod reading is right on top or very near the mean for most of the subjects but misses for a couple (ATH B and H)
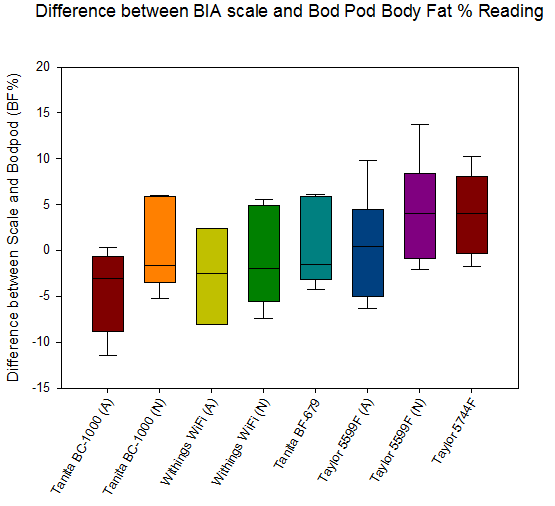
The second graph is the difference between the Bod Pod measurement and the BIA scales. If a scale gave the exact reading as the Bod Pod, the difference would be zero, if the scale gave a higher reading it would be positive and the opposite if the reading was less. The mid-line of the box is the median with the edges of the box being the 25th and 75th percentile. The whiskers represent the 5th and 95th percentiles of the readings. Here we see some interesting trends. Most of the scales are centered around zero and some have a smaller spread than others but overall they look pretty similar. The Taylor 9955F seems to be a little more variable than the rest. If we look at the 3 scales operating in “athlete” or “normal”, the Tanita and Taylor model give higher readings in normal mode while the Withings scale looks like the readings are the same in either setting. Also, as Ray noted, the normal mode gave readings more in line with the Bod Pod.
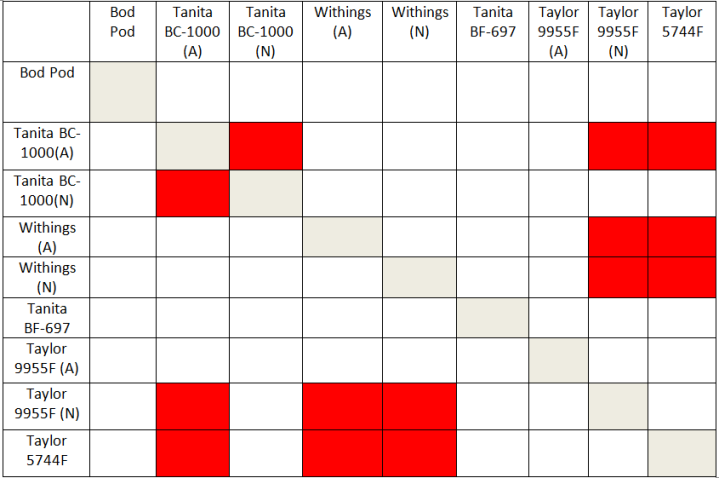
To have a more thorough understanding of the data I applied a Repeated Measure 1-Way ANOVA test with Tukey’s Post-hoc to tell me if any of the devices are significantly different from each other. The results are interesting but not how you’d expect. The full statistical results can be found here. The results are summarized in the table below. A red box indicates that the two devices are significantly different (p<0.05).
It looks like the measurements given by any of the scales are not different than the Bod Pod readings. The Tanita BC-1000 in athlete mode is trending but did not reach the 5% threshold (p=0.08). The Taylor 9955 in normal mode was also approaching significant (p=0.09) but trending higher than the Bod Pod. Interestingly, the difference between the athlete and normal mode was not significant for the Withings or Taylor scales suggesting it doesn’t matter which mode you use. The Tanita did give significantly different readings based on the mode with athlete mode giving lower readings. Again note that the term significant or different here is from a statistics terminology standpoint, and not a clinical (real life) standpoint.
Conclusions
All the scales tested give BF% measurements that is not statistically different than what the Bod Pod will spit out based on the population Ray used (self defined athletes who podium occasionally). Also it appears that athlete mode may not be necessary in the scales which have it (only the Tanita gave readings which were different between the two settings). Some people may get vastly different readings (athlete E) on different devices but on a whole the 9 devices are surprising similar.
Of course, these data say nothing about the absolute accuracy of the BIA scales or the Bod Pod, they are merely comparing the different devices. If we wanted to say something about the accuracy of the devices, we’d need to be comparing them to the gold standard measurement technique (DEXA) and we don’t have that data at this time. BIA scales and Bod Pod typically have an accepted accuracy of 3 BF% or so and we need to remember that. It could be theoretically possible that the scales are hitting the absolute BF% right on and the Bod Pod is the device that is missing the target. Looking at the first graph, it looks like for ATH B and H, the Bod Pod reading is quite a bit from the mean of all the devices. These two subjects may be poorly defined by the Bod Pod for some reason (maybe they have giant afros which mess with the air displacement) and BIA does a better job, we just don’t know.
While we don’t know about the accuracy, the BIA scales are overwhelmingly precise from my and others’ experience. If you measure the same way every day (i.e. methodology including hydration), the readings day to day will be consistent, allowing you to follow trends in the data to see how your BF and lean mass are changing over time. For those unsure about the difference between Accuracy and Precision you can read up here.
After seeing the data and analyzing it, I’m confident that the scales are a reasonable alternative to more expensive testing like the Bod Pod if you want an idea of your BF%. Because the absolute error of BIA and Bod Pod is similar, you’d be best off splurging and going to a more accurate testing method (DEXA) if you want pinpoint BF%. To me, it’s just not worth it of all the reasons Ray covered in the summary Part II.
Disclaimer:
I’m not a statistician; just a biomedical research student and pharmacist so while I think the analysis is valid/correct don’t hold me to it. Feel free to criticize my interpretation or present a different viewpoint, I’ll try not to take it too personally. Other than using a BIA scale, I also have no vested interest (financial or otherwise) in the performance of any of the devices tested.
FOUND THIS POST USEFUL? SUPPORT THE SITE!
Hopefully, you found this post useful. The website is really a labor of love, so please consider becoming a DC RAINMAKER Supporter. This gets you an ad-free experience, and access to our (mostly) bi-monthly behind-the-scenes video series of “Shed Talkin’”.
Support DCRainMaker - Shop on Amazon
Otherwise, perhaps consider using the below link if shopping on Amazon. As an Amazon Associate, I earn from qualifying purchases. It doesn’t cost you anything extra, but your purchases help support this website a lot. It could simply be buying toilet paper, or this pizza oven we use and love.









While reading the first parts of this blog I was wondering just how accurite the Bod Pod is? I have only ever had my ‘fat’ measured with calipers (or is that not very good) and how about weighing with a balance scale?
Great, great post!!! I passed my statistics class with a D, so I am glad I can understand the results better. Thank you for cooperating on this guys! :-)
Very cool post! I’m a physicist so probably that’s why I found it cool :-). The scales are quite accurate when it comes down to relative measurement. I mean if you jump on and off repeatedly you don’t see much change. Which is great because you can track the trend over some months.
I enjoyed reading this guest post even though I’m a lawyer (and all that implies regarding my math skills). It would be interesting to see these scales compared to the gold standard.
Thanks.
Richard
Ray, please consider a test to compare the DEXA test, the BIA scales, and the caliper method. Thanks.
Hi Ray !!!
You will not give up..you will just not give up on this BF Scale that does not work.
After all this, you now bring in a “stat” maverick to try and jumble the numbers around.
In the end, the “stat” maverick has the nerve to suggest that the BodPod
probably doesn’t work either.
Insanity.
Please pull the product, apologize…and lets move on.
Ok..I know, I know …just pull the product.
Thanks
Haha, well then the question is “What am I doing wrong???” I have adopted a routine of waking up, hitting the can, and jumping on my impedance scale in the morning. It’s entirely common for the scale to say 14% one day and 9% the next day.
I really am hoping for a ‘Bod Pod & Consumer Scale Comparison Tests: Part IV – NASA proves BF Scales are Dead On Balls Accurate’
I want to read about a person whose head explodes so we can find out who our troll is.
I have a pretty old Tanita and while it might not be DOBA (an industry term), it definitely shows which way I’m trending. Great article, as always.
I love this quote from the “stat” maverick….”…I like this product because it is consistently inaccurate, I just need to remember how much it is actually inaccurate and then it will be consistent”.
Ray, fire the “stat” maverick…then pull the product (please !).
Ray,
Please ban the troublemaker “MakemydayRay”. Thanks.
The best part of the MakemydayRay postings are that he does not realize that his arguments are so weak. Do you know what else is consistently inaccurate yet very precise?? The thermostat in your house. It is incidental that 72 degrees may actually be 74 as long as you recognize that it is to hot or cold then you adjust accordingly using a very precisely collaborated device… the thermostat. Likewise it does not matter if the BF scale is off your actual as long as it is consistently off and measures progress up or down with precision.
Shocking that you devote so much time to refuting something that you really don’t understand. Time to get a new hobby dude.
Hi Folks,
Thanks very much the emails of support. To those of you who plunked down $159 for the recommended scale, I am sorry there is nothing I can do.
Many of you have asked me for my opinion, here it is—-
List most accurate Bodyfat devices:
#1 DEXA – hospital xray–cost $300+
#2 Hydrostatic/underwater—university –cost $35+
#3 Lange Caliper–$200
#4 Accumeasure Caliper—$20
list reason why Body Fat is important. “..It’s important to get an accurate reading because it can show unwanted Muscle loss..this can reflect over training, poor nutrition or serious illness”.
My recommendation would be Underwater testing at your closest university.
Thanks folks !
Hi folks. Here is a different recommendation.
I have been tested with DEXA, Bodpod, and several BIA scales. DEXA is too expensive, and Bodpod requires you to go into the lab.
If you just want to see the trend of your body fat and muscle mass, get a BIA scale. Of course it is not accurate. But it is consistent. Whether you want to spend the money on a scale that will sync your data to various sources that is your choice.
Happy day Ray! :)
How do we know any of these devices are consistent? Nowhere in all three articles do I see anything about testing consistency.
We do tend to see them as consistent. We did some tests in turning them on/off with testing the sample weight in between, as well as people standing on and then back off and back on again – and registering the same.
This doesn’t mean the scales will be consistent over time as your muscle mass, water and fat changes.
Love the blog, the explanation on how BIA works and the statistic goes nicely together.
IK
This was a very interesting series, especially the statistical analysis. I can certainly agree with the punch line: Find a precise body fat scale (even if not particularly accurate), and use it to track trends over time. While it’s probably not an issue for the people reading this site, for the general population reducing body fat is far more important that losing weight. An accurate reading will require a trip to the doctor who has bought the $10,000+ device for body composition.
Incidentally, the Gold Standard for estimating fat mass/fat-free mass is neither the Bod Pod (i.e, air displacement plethysmography) nor DEXA. The Gold Standard is the Four-Compartment Model. (Current Status of Body Composition Assessment in Sport. Sports Med 2012; 42(3): 227-249) While both the Bod Pod and DEXA are part of the model, the Bod Pod is used only for total body volume and the DEXA only for calculating bone mineral content. Neither is the Gold Standard for fat mass/fat-free mass.
You tested these with athletes, but what about those of us who are trying to lose weight from morbidly obese to just “healthy”? I have lost 100lbs, but am trying to get into a healthy fat % range of 25-30% rather than being a competitive athlete. I want to see about how far off I am now, but have been told that different measurement systems can be more inaccurate for those who are obese. Can you speak to that? Using my home BIA scale, my BF% has gone from ~50% to ~37.5% with this weight loss. Is this likely to be 5% off? 3%? 10%?
I didn’t test with folks in that range unfortunately. When I did it, I basically just rounded up a bunch of friends and a few other folks I knew. Sorry!
With the new wave of wearables and scales hitting the market, have you ever thought of repeating the experiment with lessons learned?
It’s something I’d like to do again down the road, though, at the moment just haven’t had the time for it.